
Beyond energy saving in exhaust systems,
semiconductor fabs should prioritize early warning and disaster prevention ——
an AI early-warning system can prevent massive losses.
Disasters hit capacity, delay deliveries,
and damage company trust and reputation.
But disasters like this never happen suddenly.
The signal was always there —— hidden in a warning signal (abnormal vibration) no one looked into.
The precursors are in the vibration —— no one looked into them.
What if that vibration were checked by the ChiuChau AI Early-Warning System ——
This is no scare tactic —— tech-plant fires have burned real money
In the two rated Link: strong, the fire spread upward along the ducts —— exhaust systems are a known fire-spread path.
Figures and facts are from public reports (sources linked on each card). TPCA Process Exhaust System Safety Standard PCB-EHS-FS01 specifies non-combustible duct materials as the first choice. News footage is copyrighted by the original media, cited for risk education with attribution; images marked “illustrative” are not actual photos of the event.
Let every fan report to the hard-working facility team in time, automatically.
That warning signal (abnormal vibration) no one looked into, we can read it Signal received → Source analysis → OEM solution → Work order issued.
6 axes sampled together · each fan’s vibration fingerprint
Same bearing housing looseness —— spectrum, diagnosis and AI all point to it.
Eight views the facility team can monitor (ChiuChau AI Early-Warning System)
Plant overview → Continuous RMS overall vibration → Vibration time-series analysis → Alarm notifications → Work orders → Production record → Parts inventory → Budget analysis.
A fan has an invisible danger line, and an energy-saving sweet spot.
Seven fans burn over NT$30 million in power a year. Every fan has an OEM-designed sweet spot: the right speed and pressure, with peak efficiency and lowest vibration. Drift from it and power and vibration rise together — part of the wasted power turns into vibration and heat. Push pressure too low and the fan enters violent surge. Holding the sweet spot is how you save safely.
3D simulation (linked to the chart): the closer to the surge line, the harder the bearing shakes.
Too low and you near the surge line; too high and you enter the overflow zone. Only near the sweet spot are efficiency highest and vibration lowest — yet today no instrument tells you how far each fan is from it.
Power ∝ speed3. Cut speed 10% and power drops about 27%; every extra revolution is paid for cubed.
Pressure ∝ speed2. 10% more static pressure needs about 5% more speed and about 15% more power.
Near BEP, airflow is smoothest and impeller loading most even; left means surge, right means turbulence, and vibration rises either way. The most efficient point is also where the bearings are happiest.
Start with monitoring only, without changing any of your settings — the decision always stays with you.
Real damage photos — a semiconductor fab fan
A wafer fab exhaust fan, found at shop overhaul: broken inlet cone and impeller rub damage — judged to be debris in the duct (likely a damper part) that came loose and struck the running impeller.


The difference isn’t the incident itself — it’s whether anyone can read that vibration.
Every rooftop fan, AI wireless continuous monitoring, 24 h.
Current vs optimized side by side — same airflow, each fan ≥10% margin, kW and power cost compared continuously.
Without changing any of your settings — the decision always stays with you.
Why the OEM, ChiuChau
Taiwan’s only industrial fan provider spanning manufacturing / AI monitoring / maintenance
under one roof.
Long-time supplier to major semiconductor, display and chemical plants; every fan’s drawings, BOM and record are in our database.
Spectrum analysis, expert rules, AI models and UI developed by ChiuChau; we own data, models and UI end to end.
When an anomaly is detected, OEM technicians come on site; monitoring and repair from one company, no handoff gaps.
This fan · Order ××××-××××Turbo fan ×××× · 250 HP 4P · belt drive
Flow 2,000 m³/min · Static 3,500 Pa · Speed 1,060 rpm · ISO 20816-3 Group 2, flexible support
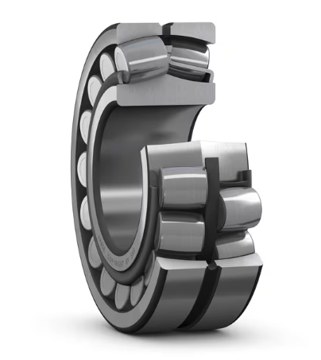
spherical roller bearing
Once metal touches metal, smoke in as little as 13 days.
shortest time to failure
normal wear
Grey: MEMS
Blue bar: ISO 20816
Line: fan baseline
 Running speed only, steady noise floor
 Bearing natural frequencies (2–5 kHz) excited; typical MEMS can’t see it
 Defect frequencies appear lower down, with harmonics and sidebands
 Peaks turn into a raised noise floor; high frequencies drop
 Slight energy rise in the defect-frequency band
 Outer race BPFO and harmonics appear
 BPFO grows; inner race BPFI and sidebands appear
 BPFO still there, noise floor raised
Field casePump caught here; re-greased next day, no damage
- L10 life: running hours that 90% of identical bearings reach under the same load and speed; the Mobius per-stage shares exclude lubrication failure
- Maker’s regreasing formula: this bearing, fresh grease, ~4,000 h at 70 °C; halved per +15 °C
- Power plant fan lost lubrication: smoke 6 days after noise; overall vibration showed nothing
- Conveyor bearing fire at only 41 °C (alarm 65 °C); side-to-side ΔT appeared days before
- Total oil-loss test: a high-speed roller bearing failed in about 10 minutes
- Defect frequencies FTF cage · BSF roller · BPFO outer · BPFI inner; Markers from the bearing model and speed in the product record
Outer race damage: trend rises first, spectrum locates it, teardown confirms.
Reactor agitator · 2025 · motor outboard bearing. High-frequency acceleration (10–5,000 Hz), monitored continuously for four months; each bar is a run, bars at the bottom are shutdowns.
 Running speed only
 Nothing visible yet at 0–600 Hz
 Running speed up (looseness), peaks broaden
 No peaks
 Defect frequency shows in the envelope first
 1–6× in a series
 Defect frequency still there, noise floor raised
Spall pit in the outer raceway, matching the spectrum; too much grease was also found
With the OEM’s bearing data, defect frequencies can be marked on the spectrum.
Same sensors; the difference is whether you can read the spectrum.
| Criteria | Manual rounds | Temperature only | Overall vibration only | Typical online monitoring MEMS, ~2 kHz | ChiuChau (OEM) |
|---|---|---|---|---|---|
| Check interval | Once per shift or week | Continuous | Continuous | Continuous | Continuous; reporting interval set by alert level |
| Early lubrication loss | ✕Not visible | ✕Temperature not up yet | △Overall often below alert level | ✕Lubrication-loss changes are above 2 kHz | ○2–5 kHz spectrum and envelope already changing |
| Spectrum & waveform | ✕ | ✕ | ✕Just one number | △0–2 kHz spectrum only | ○0–5 kHz, every reading stored, 3-axis |
| Bearing defect frequencies | ✕ | ✕ | ✕ | △Bearing model unknown; teardown needed | ○Bearing model in product record, calculated before install |
| After diagnosis | Personal experience | Only knows “it’s hot” | Only knows “high vibration” | Interpret it yourself or hire a consultant | Identifies part and cause; OEM gives the fix and opens a work order |
| Notification | Verbal report | Single alarm | Single alarm | Depends on system | 4 levels, LINE push notification + Email, escalating to managers by level |
Each fan’s bearing models and speed are in its product record, so spectrum peaks map to a specific bearing and location.
Spectrum changes first, temperature rises later; only together can you tell lubrication loss from misalignment or unbalance.
OEM technicians come on site to regrease and replace bearings, following OEM standard work procedures; no third-party confirmation needed.
Four alert levels: the more severe the alert, the denser the data and the higher the notification level.
Alarm values set for this fanOrder ××××-×××× · turbo fan ×××× · 2,000 m³/min · 3,500 Pa · 1,060 rpm · 250 HP 4P belt drive · isolator pads → ISO 20816-3 Group 2, flexible support
| Level | Vibration RMSISO 20816-3 | orBearing temp. | Data reporting | Notified | Recommended action | Expert mode |
|---|---|---|---|---|---|---|
| Level 1 Emergency | ≥ 8.9 mm/sC/D 7.1 × 1.25 | or ≥ 95 °C | Every 10 min | + Director / Deputy Director | Shut down now, OEM technician on site, repair per OEM standard work procedures | |
| Level 2 Danger | ≥ 7.1 mm/s | or≥ 85 °C | Every 20 min | + Department Manager | Spares ready, scheduled shutdown, replace bearing per OEM standard work procedures | |
| Level 3 Alert | ≥ 4.5 mm/s | or≥ 75 °C | Every 30 min | + Section supervisor (Asst. Manager / Manager) | On-site check, relubricate, schedule maintenance | |
| Level 4 Watch | ≥ 2.3 mm/s | or≥ 65 °C | Every 40 min | LINE push + facility on-duty engineer | Track the trend; check greasers and lubrication on rounds | |
| Normal | < 2.3 mm/s | < 65 °C | Every 60 min | System log, trend tracking | Continuous monitoring | — |
Layer 1 · System diagnosisExpert rules + machine learning, two models cross-checking, more accurate than one model; escalates when either vibration or temperature crosses a threshold.
Layer 2 · OEM online reviewChiuChau vibration analysts (4 Mobius CAT II, 1 CAT III) review spectra remotely; requires your consent to one-way data transfer to the OEM.
Layer 3 · On-site precision measurementWhen flagged online, the OEM sends staff with a professional spectrum vibration analyzer (PRÜFTECHNIK VibXpert II) to confirm on site.
Twelve sensors, one access point, one host. Data stays on site.

3 wireless sensors per fan on four fans, 12 in total; data goes straight to the host via a dedicated Wi-Fi access point, bypassing the plant network.
Collection, database storage, trend and spectrum analysis, diagnosis and OEM-recommended actions all run on this host; anomalies trigger automatic push alerts and work orders.
No external connection by default. Only when cloud and OEM remote diagnosis are enabled does the host connect outbound only.
Three magnet-mounted sensors per fan; no downtime from installation to acceptance.
 ① Impeller-side bearing housing
② Motor-side bearing housing
③ Motor
Drag to rotate
| Measures | Triaxial acceleration + temperature |
| Frequency range | 0.1 ~ 6,400 Hz;± 32 g |
| Environment | IP67;−40 ~ 85 °C |
| Sampling interval | One reading per hour by default |
| Power | Battery, about 1 year, field-replaceable |
| Each reading | Triaxial RMS (per ISO 10816-3 / 20816), spectrum and waveform, temperature |
- Rooftop signal survey, access point location
- Confirm steel structure and power circuits
- Installation drawings and safety plan
- Mount 12 sensors and align orientation
- Mount access point and PC Station
- Two power feeds, one network cable
- Verify each sensor’s link and data logging
- Collect operating data, set baselines
- Set ISO thresholds and notification list
- Simulated anomaly → push alert → work order
- Power-loss and network-loss recovery tests
- Training and documentation handover
Safety per your contractor rules: work at height, electrical LOTO, no hot work in this project; crews certified and briefed on hazards before entry. Warranty: one year, standalone system.
Wi-Fi: one dedicated network, for the twelve sensors only.
The rooftop PC Station and Wi-Fi access point are mounted side by side, with only a few meters of cable; all four fans in this project fall within one access point’s coverage.

Separate SSID for the twelve sensors only; physically isolated from office and process networks.
One access point covers about 52 m square; all four fans fall within it, so one is enough.
Sensors use 2.4 GHz Wi-Fi, uploading one reading per hour by default; access point and PC Station are adjacent and cabled directly, so data bypasses the plant network.
If a fan is too far from the access point and signal is weak, a bridge access point is quoted separately; not needed in this project.
Site signal survey before deployment; each sensor’s link verified after.
Configuration, options, and items for you to confirm.
| Wireless sensors | 12 | Triaxial + temperature, 0.1 ~ 6,400 Hz, ± 32 g, IP67; 3 per fan |
| Industrial Wi-Fi access point | 1 | Outdoor, with antenna; dedicated SSID covering all four fans |
| Rooftop PC Station | 1 set | AI early-warning system and data platform, fan fault prediction and OEM-recommended solutions |
| Conduit and SUPPORT | 1 lot | Cable tray on existing rooftop steel; excludes cabling to the control room |
| Labor and safety | 1 lot | Rooftop work per your contractor rules |
| Warranty | 1 year | Standalone system warranty |
- Additional fan sets: 3 sensors each, incl. on-site software setup and installation
- Bridge access point: quoted separately if a fan is too far and signal is weak
- Cloud data server, 2-year lease: OEM remote diagnosis (outbound only)
- Cabling to the control room and data integration (open API for facility systems): separate project
- Which four fans to cover
- Rooftop 2.4 GHz Wi-Fi approval and available channels
- Rooftop power source; mounting points (steel) for access point and PC Station
- Notification policy (Email, LINE, SMS); link to control room or not
Data is stored on the on-site PC Station and belongs to you. The system is read-only: no control commands, no changes to any fan or VFD setting.
Sensor batteries replaced per service life; software and model updates from the OEM, installed with your approval; OEM engineers help diagnose anomalies and visit on site when needed.
Full spec (10 pages): introduce-air.chiuchau.com/spec/ ↗
From ChiuChau, the OEM
AI early-warning system
Beyond showing numbers (vibration values)
ChiuChau helps facilities analyze what they mean

The vibration signal was always there
Starting today
let us keep you clear of failure risk
Working together for a sustainable planet